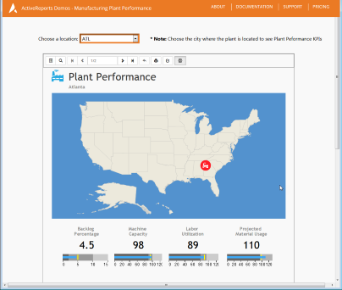
The Plant Performance sample demonstrates how to visualize the Plant Performance KPIs using the Map control.
Sample Location
Visual Basic.NET
<User Folder>\GrapeCity Samples\ActiveReports 13\Web\Plant Performance\VB.NET
C#
<User Folder>\GrapeCity Samples\ActiveReports 13\Web\Plant Performance\C#
Details
When you run the sample, the start page with the Plant Perfomance KPIs for Atlanta is displayed. On this page, you can choose another location from the drop-down list on top of the page.
The project consist of the following elements.
- Css folder: Contains css files that store styles for the viewer application.
- fonts folder: Contains font files to provide styles to the text that gets displayed in the viewer at run time.
- images folder: Contain images for the buttons used in the sample.
- Reports folder: Contains the PlantPerformance.rdlx report.
- Scripts folder: Contains javascript files and its dependencies required to build this application.
- ActiveReports.ReportService.asmx is an ASP.NET Webservices Source file that is required for creating and proper functioning of the Viewer. You can add this service using the Add New Item in the Visual Studio Project menu and then selecting ActiveReports 13 Web Service.
- index.html: Hosts the UI page on the browser. It contains html code for the appearance and functioning of this page.
- Web.config: This configuration file contains the httpHandlers that allow ActiveReports to process reports on the Web. Note that you need to manually update version information here when you update your version of ActiveReports.
